Linux /proc Filesystem Manipulation
In Linux, /proc is a virtual filesystem that exposes essential runtime information about the system. Unlike a typical filesystem, which stores persistent data on disk, /proc is dynamically generated by the kernel. Every time you query or open a file within /proc, the kernel retrieves the requested data in real time.
For a penetration tester, understanding how /proc works provides a unique window into the inner workings of Linux. Through /proc, you can gather system information, probe running processes, and even investigate network details. While many of these tasks may be straightforward to a seasoned sysadmin, the perspective of a pentester is slightly different: you’re interested not only in how the system is designed to function, but also in how it can be misused or exploited.
By developing comfort with /proc and related scripting tasks, you’ll enhance your ability to:
-
Enumerate system details during an engagement.
-
Spot suspicious processes or network activity.
-
Create or customize scripts for stealthy data-gathering.
-
Understand advanced pivoting or privilege escalation techniques that hinge on process and kernel details.
Let’s begin this journey by exploring the structure of /proc and the critical files/directories that you, as a pentester, should know about.
1. Overview of /proc
What Is /proc?
/proc is often called a process information pseudo-filesystem. It dynamically generates text files that contain system information, such as CPU details, memory usage, and active processes.
-
Virtual Filesystem: Files within
/procdon’t consume disk space in the conventional sense. They exist as interfaces to kernel data structures. -
Runtime System Information: Everything from CPU usage to network connections is available here, and it’s always up to date.
Common Directories
Some common directories within /proc include:
-
/proc/<pid>: Each running process has its own directory named after its process ID (PID). Within that directory, you’ll find details about the process’s environment, open file descriptors, execution path, and more. -
/proc/net: Contains network-related information, such as active TCP/UDP connections, ARP tables, and route tables.
For instance, if you list the /proc/net directory, you might see:
ls /proc/net 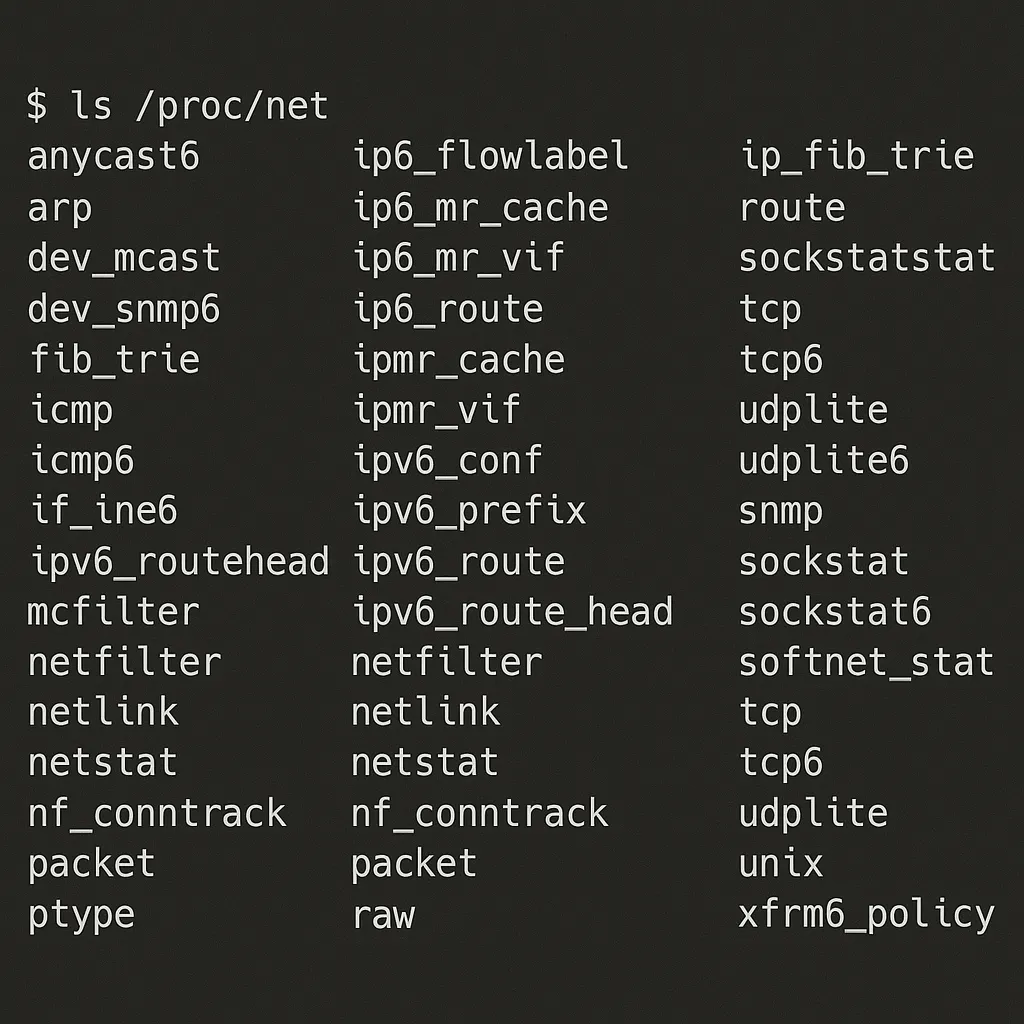
This could reveal files like tcp, udp, arp, route, and others. Each file gives you a peek into how the kernel is managing network connections. For pentesting, enumerating these files can be a quick way to see if specific ports are open or to identify the IP addresses to which the system is connected.
2. Key Files and Directories
In this section, we’ll explore some of the most valuable files and directories in /proc. Mastering these can help you quickly gather system intelligence during a pentest or just improve your Linux administration skills.
/proc/cpuinfo
-
Location:
/proc/cpuinfo -
Purpose: Shows detailed information about the CPU(s) on the system. This includes the CPU vendor, model, clock speed, and more.
When you run:
cat /proc/cpuinfoyou’ll see information that might look like:
processor       :  0
vendor_id       :  GenuineIntel
cpu family      :  6
model           :  158
model name      :  Intel(R)  Core(TM)  i7-8750H  CPU  @  2.20GHz
cpu MHz         :  2194.680
...
For penetration testers, CPU details can be relevant in a few situations:
-
Tailored Exploits: Certain kernel-level or CPU-specific vulnerabilities may only affect particular architectures.
-
Resource Constraints: Knowing how many cores/threads a target system has might help you plan CPU-intensive attacks (like password cracking or hash computations) on the target.
/proc/meminfo
-
Location:
/proc/meminfo -
Purpose: Displays detailed memory usage statistics.
Sample command and output snippet:
cat /proc/meminfoMemTotal: 16325820 kB
MemFree: 8294500 kB
Buffers: 482860 kB
Cached: 5263404 kB
SwapCached: 34148 kB
...From a pentesting perspective, memory usage details can be useful to understand:
-
System Stability: If the system is running extremely low on memory, it may be more susceptible to denial-of-service attacks.
-
Forensic Clues: Knowing how the system caches data can give you hints about where ephemeral or leftover data might exist in memory.
/proc/loadavg
-
Location:
/proc/loadavg -
Purpose: Shows the system load averages for the last 1, 5, and 15 minutes, plus additional scheduling-related information.
A typical content of /proc/loadavg looks like:
0.12 0.14 0.16 1/124 3921The first three numbers show how busy the system has been over 1, 5, and 15 minutes, respectively. For example, a load average of 1.0 on a single-core system means the system is fully utilized.
For a penetration tester, high loads might mean:
-
Resource Exhaustion Attacks: If you’re testing the system’s resiliency, you might want to see if your attack is driving up load.
-
Suspicious Activity: Sometimes malicious processes spike the load. Monitoring
/proc/loadavgcan be a quick way to detect anomalies.
Process-Specific Directories: /proc/<pid>/
Each process running in Linux gets its own directory under /proc. If you have a process with PID 1234, you can explore:
ls /proc/1234You may see files like cmdline, environ, exe, cwd, fd, and more. Each of these reveals different aspects of that process:
-
cmdline: How the process was invoked, i.e., the command-line parameters. -
environ: Environment variables of the process. -
exe: A symlink pointing to the binary that started this process. -
fd: A directory containing file descriptors that the process holds open.
This information is particularly valuable in pentesting:
-
Credential Hunting: Sometimes environment variables or command lines store sensitive credentials.
-
Process Hijacking or Replacement: If you gain enough privileges, you might manipulate what a process is doing by overwriting files or linking to malicious binaries.
-
Privilege Escalation: Identifying processes running as root and seeing if they open sensitive files can be a stepping stone to escalate privileges.
/proc/net/
The /proc/net/ directory houses networking information. Some critical files in this directory include:
-
tcp,tcp6: Show active TCP connections (IPv4 and IPv6). -
udp,udp6: Show active UDP connections (IPv4 and IPv6). -
arp: Contains the ARP cache, mapping IPs to MAC addresses. -
route: Kernel routing table.
Example: Checking Active TCP Connections
cat /proc/net/tcpYou’ll see lines showing the local address, remote address, and connection state. Though the output is often in hexadecimal, tools like netstat -an or ss -t -a parse and display it in a human-readable manner. Still, /proc/net/tcp is the raw source that those commands rely on.
For a pentester:
-
Connection Enumeration: Determine which IP addresses and ports the target is communicating with, possibly revealing a second staging server or hidden administrative service.
-
ARP Spoofing or MITM: Reviewing
/proc/net/arpto see which hosts the target system believes are local can provide insights for ARP-based Man-in-the-Middle attacks.
3. Pentesting and /proc
Now that you’ve seen some of the most important files in /proc, let’s discuss how you can apply this knowledge in a penetration testing context. Remember: the key is to balance legitimate system administration tasks with the pentester’s mindset of discovering and exploiting weak points.
Gathering Valuable System Information
When you first gain a foothold on a Linux system—perhaps through a remote code execution vulnerability or a misconfigured service—you’ll want to learn as much as possible about the environment. /proc can help:
-
CPU and Memory Info: Quickly figure out the system’s specifications using
/proc/cpuinfoand/proc/meminfo. This helps you assess if the machine is a powerful server or a tiny IoT device. -
OS and Kernel: Files like
/proc/versioncan reveal kernel versions, which may be vulnerable to specific exploits. -
Process Enumeration: By enumerating directories like
/proc/<pid>, you might discover:-
Services running with root privileges.
-
Processes using plain-text credentials in environment variables (
/proc/<pid>/environ). -
Misconfigurations or hidden processes.
-
Monitoring Resource Usage for Suspicious Process Behavior
Malicious processes often behave differently from legitimate ones; they may consume more CPU/memory than expected, or they might open unusual network ports. By regularly checking files in /proc, you can spot anomalies.
- Scripting a Basic Monitoring Tool: You can write a small Bash script that checks
/proc/loadavgor/proc/<pid>/statusfor suspicious behavior. For instance:
#!/bin/bash
# rudimentary CPU usage check for suspicious processes
for pid in $(ls /proc | grep '^[0-9]\+$'); do
	if [ -f /proc/$pid/status ]; then
		cpu_usage=$(cat /proc/$pid/stat | awk '{print $14+$15}') # utime + stime
		if [ "$cpu_usage" -gt 100000 ]; then
			echo  "Process $pid is consuming a lot of CPU time"
		fi
	fi
done
This script is simplistic; it merely sums up user and system CPU time for each process. But it illustrates how reading from `/proc` can provide a foundation for custom monitoring.2. Automated Alerting: During a penetration test, you can leave behind a backdoor or script that keeps tabs on other processes to see if an administrator tries to hunt you down by launching new tasks or changing system performance drastically.
Using /proc for Deep Insights Into Linux Internals
As you advance in your penetration testing career, you might encounter kernel exploits or advanced pivoting techniques that rely on a profound understanding of Linux internals. /proc is your training ground to learn about how the kernel manages processes, memory, and I/O. For example:
-
Kernel Modules: The file
/proc/moduleslists loaded kernel modules, which might be exploitable or misconfigured in some contexts. -
Syscalls and Kernel Parameters:
/proc/sys/contains many tunable parameters that can be modified to change system behavior. Some of these tweaks can be leveraged to escalate privileges or bypass security controls if the system is not secured properly.
Suggested Learning Path
Here is a structured approach to mastering /proc for both Linux administration and pentesting:
-
Initial Exploration
-
Goal: Familiarize yourself with the layout of
/proc. -
Suggested Exercises:
-
Run
ls /proc/and note directories like1,self,sys,net, etc. -
Pick a process—such as the shell you’re using—and explore its
/proc/<pid>/directory. Look atcmdline,environ,exe, andfd.
-
-
-
Key File Analysis
-
Goal: Understand how each file provides system information.
-
Suggested Exercises:
-
Review
/proc/cpuinfo,/proc/meminfo, and/proc/loadavg. -
Use
awkorgrepto parse these files for quick scanning. For example:
-
-
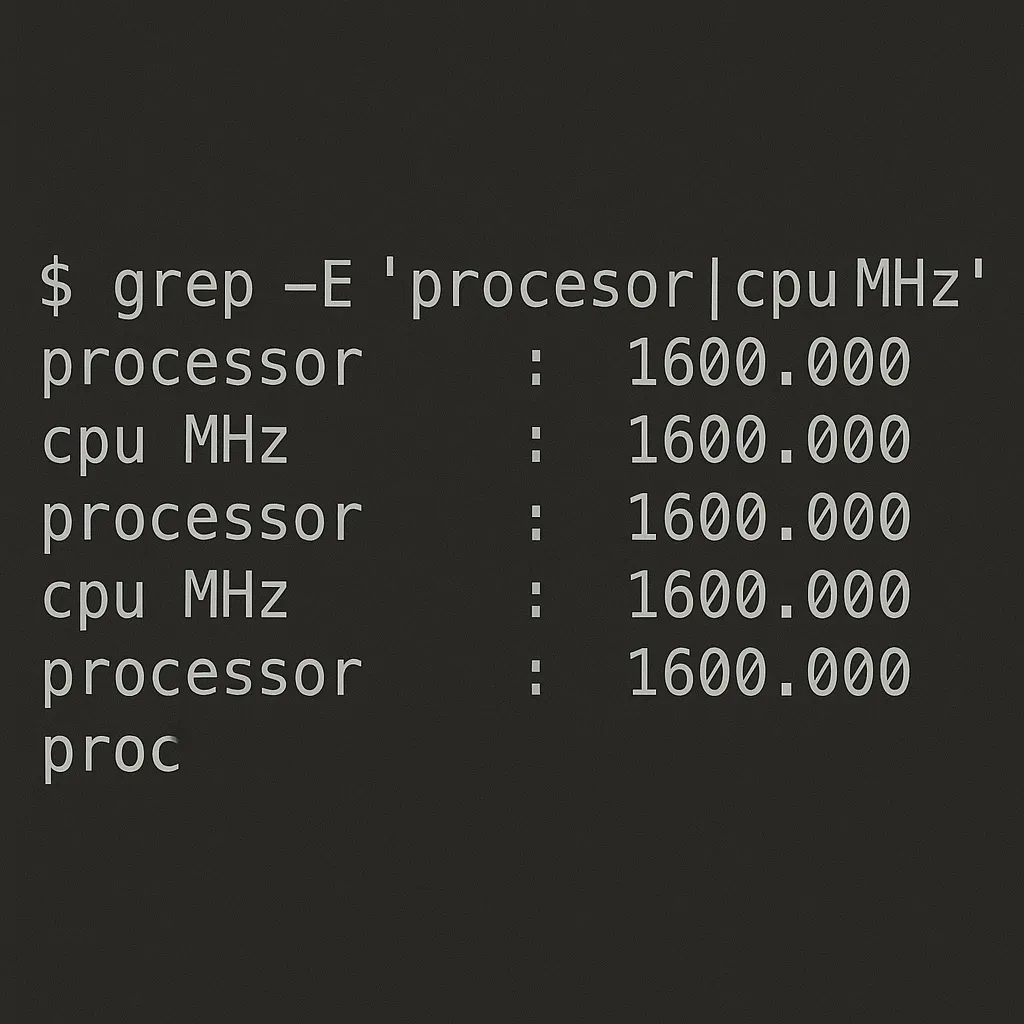
grep -E 'processor|cpu MHz' /proc/cpuinfoThis quickly shows how many processors there are and their clock speeds.
-
Networking Insight
-
Goal: Become comfortable with
/proc/net/for enumerating connections. -
Suggested Exercises:
-
View active connections by
cat /proc/net/tcp(and similar files). -
Compare the output with the user-friendly
ss -antpornetstat -anp. -
Practice identifying if suspicious connections exist.
-
-
-
Process Forensics
-
Goal: Develop the ability to investigate running processes.
-
Suggested Exercises:
-
Pick an actively running process (e.g., Apache or Nginx) and examine
/proc/<pid>/environto see its environment variables. -
Check
/proc/<pid>/fdto see which files or sockets it has open.
-
-
-
Scripting Challenges
-
Goal: Create small scripts that leverage
/procdata. -
Suggested Exercises:
-
Write a Bash script to list top CPU-consuming processes using
/proc. -
Automate a memory usage checker.
-
Integrate these scripts into your pentesting workflow—e.g., after you gain a reverse shell, run your scripts to gather environment data.
-
-
-
Advanced Exploration
-
Goal: Delve into kernel modules, system calls, and security implications.
-
Suggested Exercises:
-
Investigate
/proc/sys/to see tunable kernel parameters. -
Research how improper sysctl configurations can lead to vulnerabilities (e.g., enabling IP forwarding in some contexts could create an unintended router).
-
Practice how you might use knowledge of loaded modules to attempt local privilege escalation in a capture-the-flag environment.
-
-
Final Thoughts
Becoming proficient with /proc is an excellent stepping stone toward Linux mastery. As you grow in your pentesting journey, you’ll see that many vulnerabilities or stealthy exploitation strategies tie back to how well you understand the operating system’s internals. /proc provides a direct lens into these internals, enabling you to:
-
Identify System Weaknesses: By enumerating processes and kernel data, you can more easily see if the system is misconfigured or vulnerable.
-
Monitor Exploit Impacts: Checking
/procbefore and after launching an exploit helps you verify if your exploit has had the desired effect—whether that’s elevating privileges, causing a denial-of-service, or exfiltrating information. -
Script Custom Tools: One size doesn’t always fit all. Relying on generic tools is fine, but in specialized pentests, customizing your toolset by reading from
/proccan give you an edge.
Remember: With great power comes great responsibility. /proc can expose sensitive data, so always adhere to legal and ethical guidelines when performing a penetration test. Unauthorized or irresponsible use of /proc to glean system secrets can cause you serious legal or ethical trouble.
Now that you’ve read about the basics of the /proc filesystem, go out there and start experimenting. The best way to learn is by doing—spin up a virtual machine, break it, fix it, and take notes every step of the way. Over time, this exploration will make you a formidable pentester, capable of bridging the gap between system administration and offensive security.
Quick Recap Checklist
-
/procas a Virtual Filesystem: Always up-to-date, no real disk usage. -
Important Files:
/proc/cpuinfo,/proc/meminfo,/proc/loadavg. -
Process Details:
/proc/<pid>/cmdline,/proc/<pid>/environ, and/proc/<pid>/fd. -
Network Info:
/proc/net/tcp,/proc/net/arp,/proc/net/route, etc. -
Pentester Usage:
-
Enumerate system specs and potential vulnerabilities.
-
Monitor suspicious processes and resource usage.
-
Investigate loaded kernel modules and sysctl parameters.
-
-
Suggested Exercises: Scripting around
/proc, analyzing processes, checking network states, and exploring advanced kernel parameters.
With these foundations, you’ll be well-equipped to build advanced pentesting scripts and dive deeper into the Linux kernel’s inner workings. Good luck, and happy hacking in a responsible manner!
Test Your Knowledge
What is the purpose of the "/proc/cpuinfo" file in Linux?
Which of the following is true about the "/proc" directory?
You’ve gained a low-privilege shell on a Linux system. Which "/proc" file can help you check current system load to hide or time your activity?
You suspect a process is behaving maliciously. Which "/proc/<pid>/" file would most likely contain clear-text credentials if the process was started improperly?
What insight can a pentester gain by analyzing the file "/proc/net/arp"?